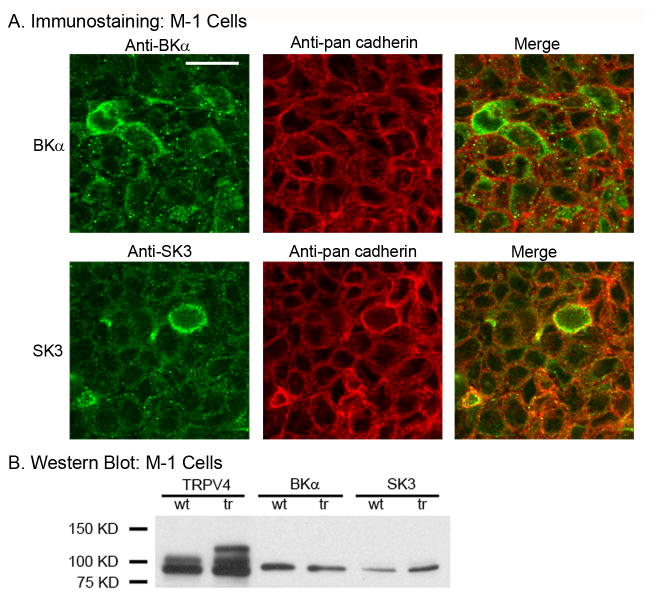
Figure 5.
Expression of BKα and SK3 K+ channels in M-1 cells. A. Immunofluorescent staining of M-1 cells for BKα (Anti-BKα, green) and pan cadherin (Anti-pan cadherin, red) (Upper panel) and for SK3 (Anti-SK3, green) and pan cadherin (Anti-pan cadherin, red) (Lower panel). Merged images show modest collocation of BKα and SK3 with pan cadherin at the plasma membrane. Scale bar = 20 μm. B. Western blot analysis of TRPV4, BKα, and SK3 expression levels in wild type (wt) M-1 cells and in TRPV4-transfected (tr) M-1 cells. Note, the TRPV4 construct used for transfection (TRPV4 tagged with mVenus) runs higher on immunoblots and, therefore, leads to multiple bands on the immunoblot. TRPV4 expression levels were, as expected, greatly elevated with TRPV4 overexpression (tr) whereas BKα and SK3 showed little or no dependence on TRPV4 overexpression levels.

