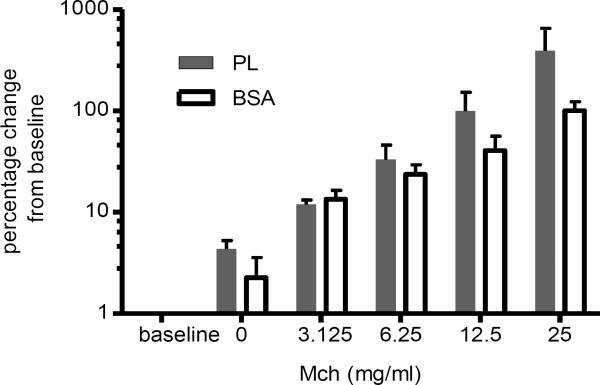
Figure 4. PL-induced airway hyperreactivity.
Lung function measurements were performed on a subset of PL-treated (n=6) and BSA-treated mice (n=4) 24 hours after treatment. Lung resistance was assessed using the Flexivent system in anesthetized, canulated and ventilated mice following inhalation of increasing doses of MCh as indicated. Data are expressed as the percent change over baseline. The baseline values for the PL-treated and BSA-treated groups were 0.97±0.08 and 0.96±0.09 cmH2O.s/min. The Area Under Curve values (expressed as means ± SD) were significantly different between the PL and BSA-treated groups (p<0.05; Mann-Whitney U test).

