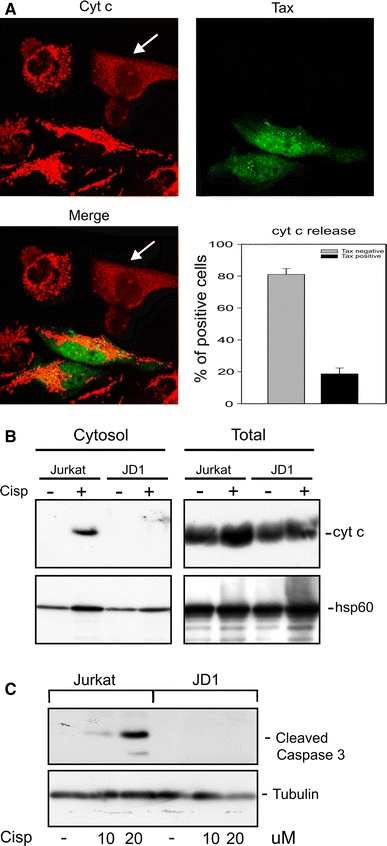
Fig. 3.

Analysis of cytochrome c distribution in Tax-positive and Tax-negative cell lines after cisplatin treatment. a Confocal analysis of HeLa-tat cells transiently transfected with a CMV-Tax plasmid and then treated with 60 µM cisplatin for 6 h. Arrows indicate cells with cytochrome c release. Graph represents percentage of Tax-positive and Tax-negative HeLa-tat cells exhibiting cytochrome c release; data report mean values ± SE of at least 600 cells randomly counted in three independent experiments. b Western blot analysis of cytochrome c release in Jurkat and JD1 cells after treatment with 5 µM cisplatin for 24 h. Digitonin-extracted cytosolic or total protein fractions were separated by SDS-PAGE and immunodecorated using antibody specific for cytochrome c. The hsp60 antibody was used as control. c Western blot analysis of caspase 3 activation in Jurkat and JD1 cells after treatment with cisplatin for 24 h; tubulin is shown as a loading control
