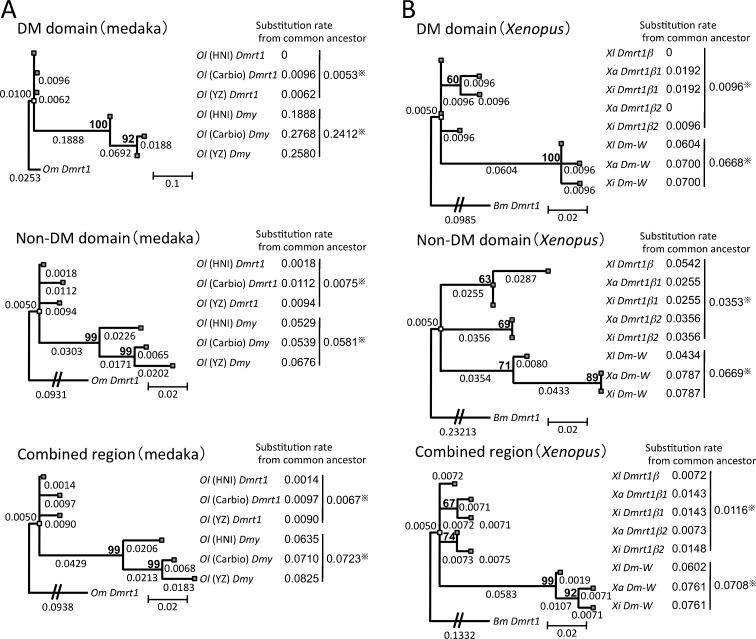
Fig. 3.
Comparisons of substitution rates among Dmy, Dm-W, and their prototype gene Dmrt1. The phylogenetic trees were constructed from three groups of medaka and O. marmoratus (Om) as an outgroup (a) or three species of Xenopus and Bufo marinus (Bm) as an outgroup (b), using the maximum likelihood method based on the Tamura 3-parameter model with 4 discrete gamma distribution categories (a) or Kimura 2-parameter model (b). The three trees of each panel were derived from the DM domain region (upper), the non-DM domain region (middle), and their combined region (lower). The number shows the branch length, which was defined as the number of nucleotide substitutions per site for the branch. The substitution rates of Dmy or Dm-W and their prototype gene Dmrt1 (right side of each panel) were calculated using the branch lengths from the position of their common ancestor (white block) to the branch tip corresponding to each gene (gray block). Bootstrap percentage values of 500 replications are shown in bold above the node. Dmy and Dm-W diverged from the their prototype genes 10 and 13–64 million years ago, respectively (Kondo et al. 2004; Bewick et al. 2011). *An average of the substitution rates of sex-determining genes or thier prototype gene. Ol, O. latipes; Xl, X. laevis; Xa, X. andrei; Xi, X. itombwensis

