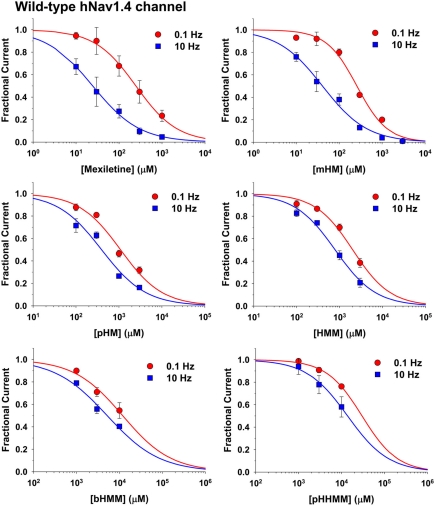
Figure 3.
Concentration–response relationships for mexiletine or hydroxylated analogs on hNav1.4 channels. The curves were constructed at 0.1 and 10 Hz frequency stimulation, and fitted with a first-order binding function (Eq. 1 in Materials and Methods). Each point is the mean ± SEM from at least three cells. The calculated IC50 values ± SE of the fit are reported in Table 2. The slope factors ranged between 0.71 and 1.22.

