Figure 6.
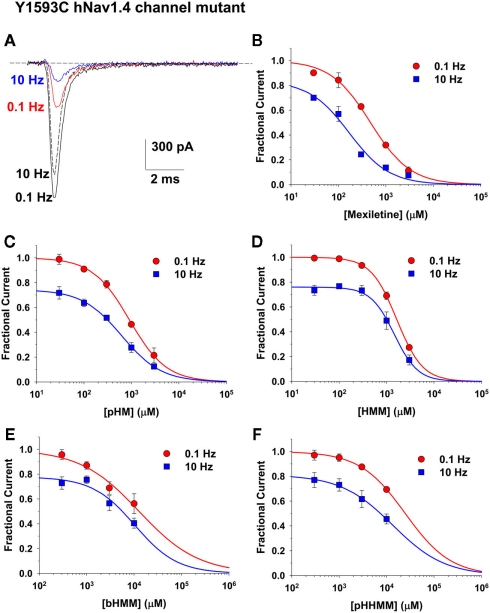
Concentration–response relationships for mexiletine and hydroxylated analogs on Y1593C hNav1.4 channel mutants. (A) Representative sodium current traces recorded in a HEK293 cell permanently transfected with Y1593C hNav1.4 mutant, by depolarizing the cell to −30 mV from an holding potential of −120 mV at 0.1 and 10 Hz stimulation frequency, before and during application of 1 mM mexiletine. Note the use-dependent current reduction in absence of drug. (B–F) The concentration–response relationships were constructed at 0.1 and 10 Hz frequency stimulation, and fitted with a first-order binding function (Eq. 1 in Materials and Methods). Each point is the mean ± SEM from at least three cells. The calculated IC50 and Imax values ± SE of the fit are reported in Table 2. The slope factors ranged between 0.69 and 1.76.

