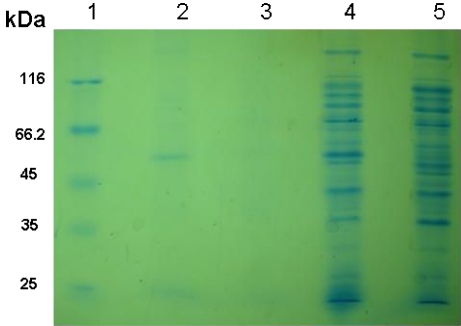
Fig. 2.
SDS-PAGE analysis of rSAG1 expression using 15% SDS-PAGE. Lane 1, molecular protein marker (Fermentas, Lithuania Cat). Lane 2, purified rSAG1 protein. Lane 3, blank. Lane 4, expression of SAG1 fusion protein at 52.4 kDa after 7 h of induction. Lane 5, induced control culture of cells lacking the SAG1 insert

