
Figure 3.
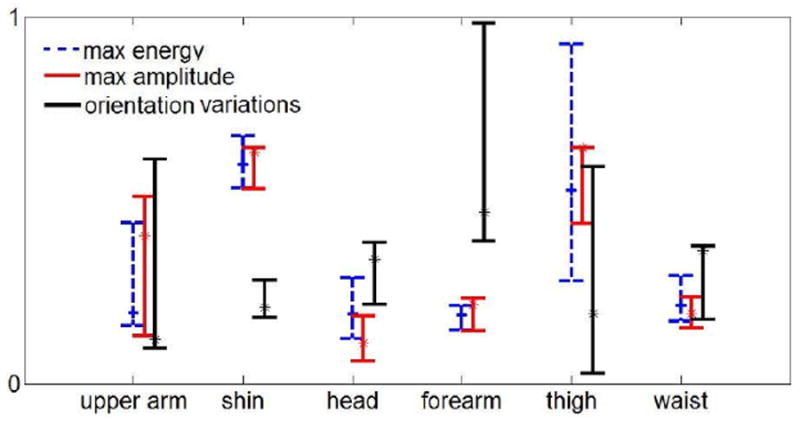
Variation of three features for a subject in different sensor locations. Data is captured in a 5 minute time frame. Y axis is normalized. Blue is the maximum energy of the power spectrum, red is the maximum amplitude among all direction, and black is the average number of orientation variations in a 5 minute time frame.