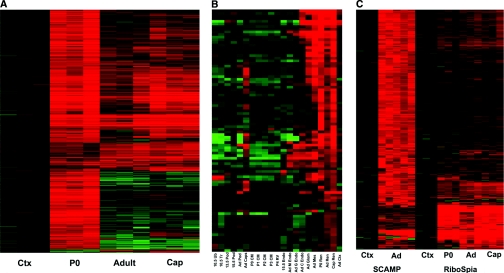
Figure 2.
The transcriptome of renin cells is vastly different from any other renal cell type. (A) Heatmap of 1051 probesets, showing differential expression in adult total kidney cortex (Ctx) and renin expressing cells from newborn (P0), adult, and captopril-treated adults (Cap). Each horizontal line represents one probeset expression, with red showing high-level expression. (B) Heatmap of renin cell-enriched genes, comparing across multiple cell types. Developmental times are given (E10.5, E13.5, Adult, P0, P1, P2, P3, P4, E15.5), as are tissue compartment (Ub, ureteric bud; Tr, trunk; Pod, podocyte; CM, cap mesenchyme; RV, renal vesicle; Endo, endothelial cells; M Endo, medullary endothelial cells; G Endo, glomerular endothelial cells; C Endo, cortical endothelial cells; Glom, glomerulus; Mes, mesangial cells; Ren, renin-expressing cells; Cap Ren, renin cells from captopril-treated adult; Ctx, total renal cortex). (C) Heatmap of 369 most specific adult renin cell genes, derived from both single cell analysis (SCAMP) and RiboSpia analysis. Ctx, total kidney cortex; Ad, adult renin cells; P0, newborn renin cells; Cap, adult captopril-treated renin cells. See also Supplementary Figure 1 and Supplementary Tables 1, 2, and 3.

