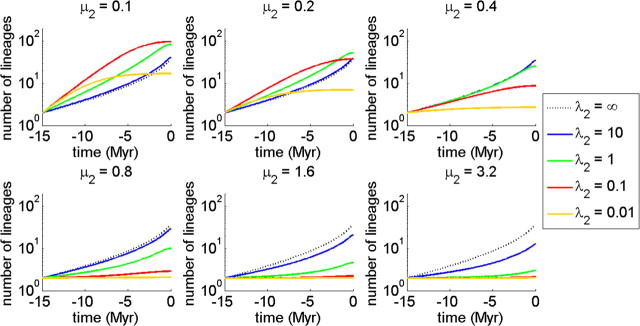
FIGURE 5.
Expected LTT plots for the protracted birth–death model for various values of the incipient species extinction rate μ2, where the extinction rate of good species is set at μ1 = 0.4. The lines are for different speciation completion rates λ2. The value of the speciation initiation rate λ1 is set at 0.5.

