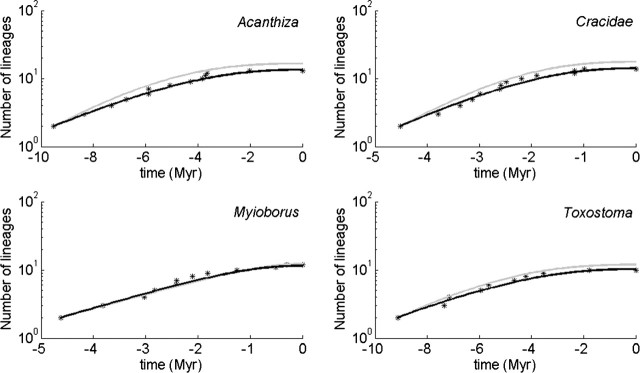
FIGURE 6.
LTT plots (stars) of four bird phylogenies, selected from Phillimore & Price (2008) (see text for selection criteria) and the fits of the protracted birth model (gray) and the protracted birth–death model (black). The former is obtained through maximum likelihood, the latter by least squares (see text). We assumed that μ2 = μ1 and λ3 = λ1, so the fitted parameters are λ1, λ2, and μ1.

