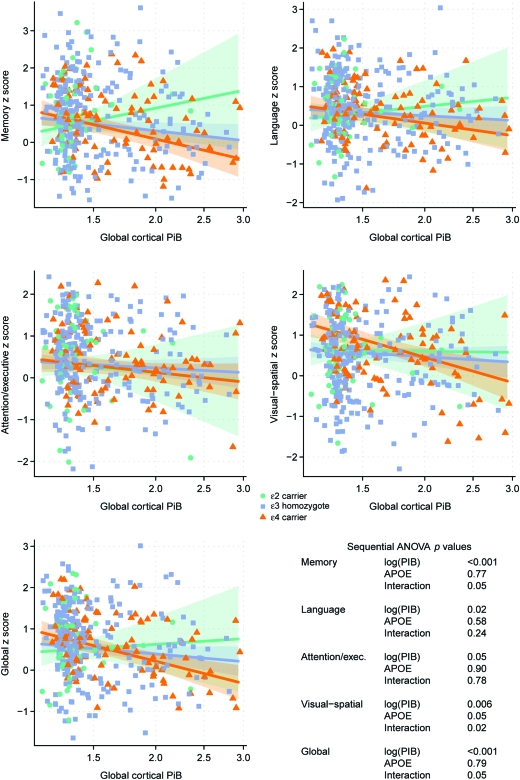
Figure 2. Associations between global cortical Pittsburgh compound B (PiB) retention and standardized cognitive scores according to APOE status.
The trend lines indicate estimated mean cognition as a function of log-transformed PiB with green representing APOE ϵ2 carriers (n = 51), blue representing APOE ϵ3 homozygotes (n = 254), and orange representing APOE ϵ4 carriers (n = 97). Shaded regions indicate 95% confidence intervals. The p values from the sequential analysis of variance (ANOVA) are listed for each cognitive domain.

