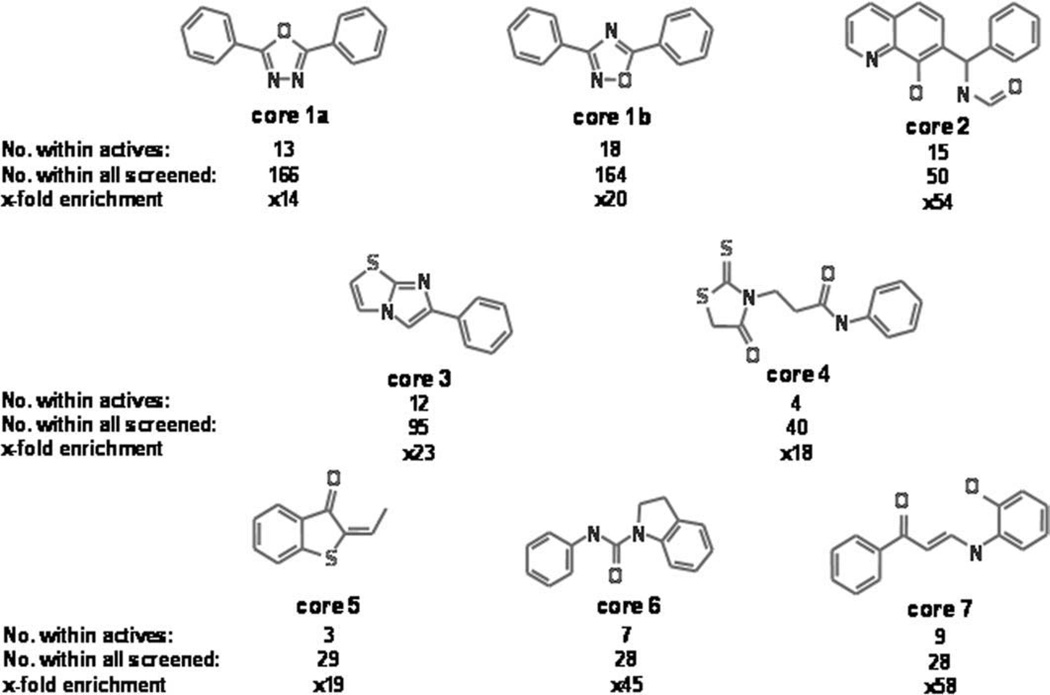
Fig. 2.
Clustering analysis of the hit population. Clustering analysis performed as described under Material and Methods revealed several enriched common core structures. These substructures were prioritized using an enrichment analysis that compares the presence of core structures in the active set with their distribution in the entire library screened. Core structures with an enrichment value higher than 14 are shown. The number of active compounds with a similar structure as well as the total number of similar compounds present in the screened library regardless of their activity is reported.

