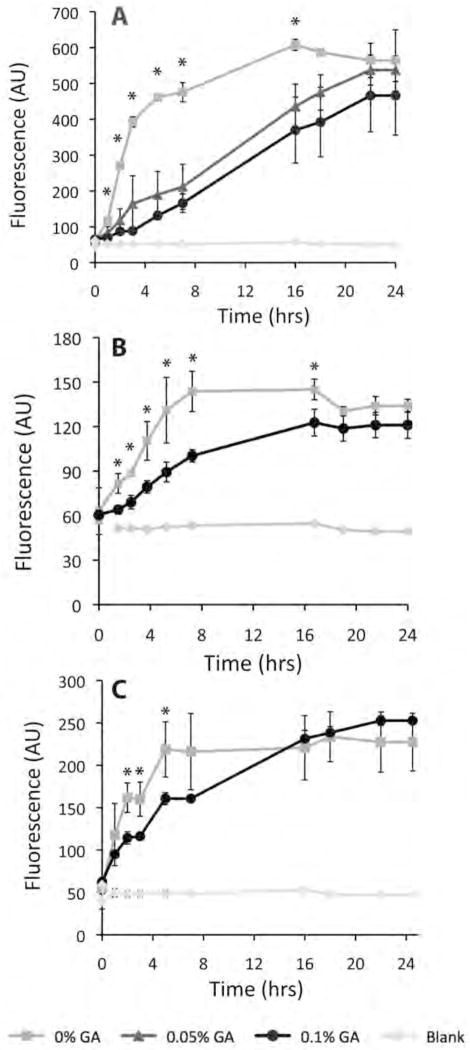
Figure 4.
Cellular migration through crosslinked gels. Plots of cellular migration of (A) 3T3 fibroblasts, (B) RASMCs, (C) HCAECs on myocardial matrix gels of varied crosslinking %. *p<0.05 indicates statistical difference among groups by ANOVA for 3T3 migration, and statistical difference by t-test for RASMCs and HCAECs.

