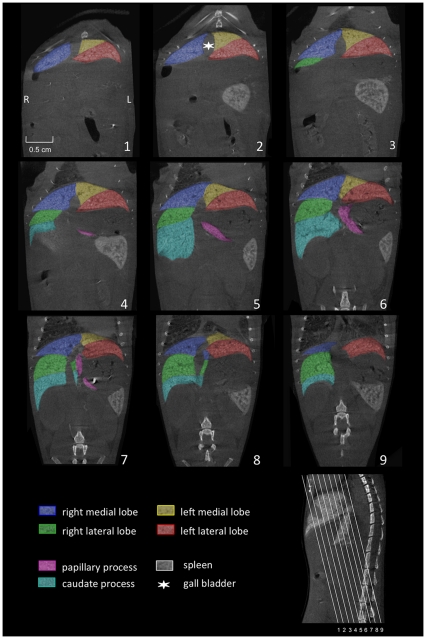
Figure 2. Coronally reconstructed micro-CT images.
Imaging of the liver of a C57BL/6J mouse was performed 3 hours after i.v. injection of 100 µl of a nanoparticular contrast agent (ExiTron nano 12000). The color-coding of the single liver lobes corresponds to the color coding presented in Figure 1. The slice orientation in relation to the spine is shown in the lower right corner.

