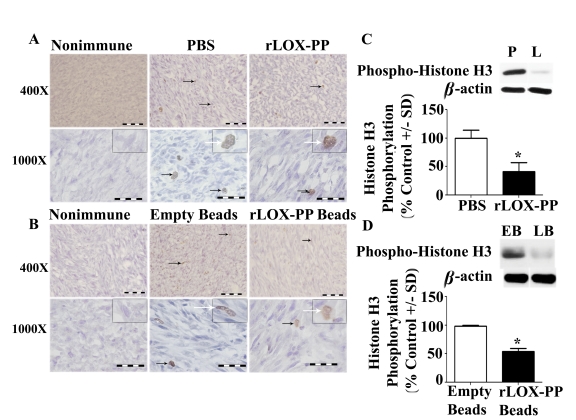
Figure 5. Proliferation marker phosphorylated histone H3 is decreased by rLOX-PP treatment.
(A) Immunostaining with phospho- histone H3 antibody or nonimmune IgG control tumors after (A) direct i.t. injection of rLOX-PP (L) compared to PBS (P) and (B) after implantation of empty (EB) and rLOX-PP (LB) alginate beads. Black arrows mark some positive-stained cells; the white arrows point to an inset containing an enlarged image of a stained cell. Scale bars correspond to 0.005 mm for 400× and 0.002 mm for 1000×. Arrows mark some positively stained cells. (C) Western blot analyses of 17 kDa phospho- histone H3, 36 kDa beta-actin and the corresponding quantifications of protein extracts from tumors after (C) direct i.t. injections of rLOX-PP compared to PBS and (D) after implantation of empty and rLOX-PP alginate beads (*, p<0.01; n = 3).

