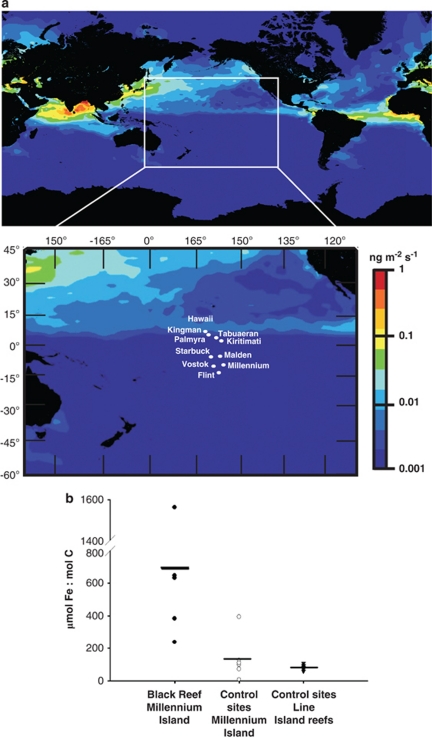
Figure 3.
Regional and local iron concentrations. (a) Iron concentrations across the world with an emphasis on the central Pacific (data for oceanic iron concentrations were taken from Behrenfeld et al., 2009). The colored bar estimates iron deposition (ng m−2 s−1). (b) The elemental stoichiometry of iron incorporated into the tissues of benthic organisms from the black reef, control sites on Millennium and from other LI reefs. Iron and carbon concentrations were measured using ICP-OS and EA, respectively. The horizontal line represents the mean of each data set.

