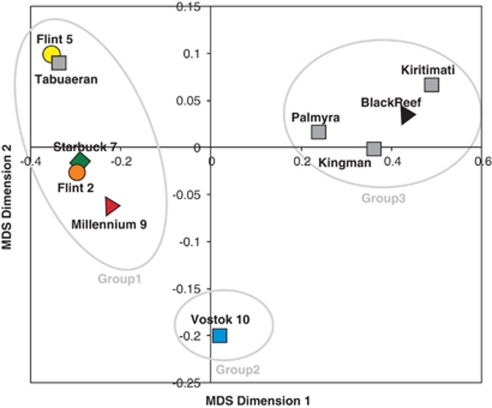
Figure 5.
Metabolic profile for the microbial community inhabiting the black reef compared with nine other coral reefs. The scatter-plot depicts the first two dimensions of the nMDS analysis. The 10 microbial metagenomes used for this analysis include six southern and four northern LI coral reefs (Dinsdale et al., 2008b). Metagenomic libraries collected from northern LI reefs are depicted with gray squares. Metagenomic libraries collected from the same atoll are depicted with the same symbol (for example, circles for Flint and triangles for Millennium). The three grouping shown were determined by a similarity profile test (P⩽0.05).

