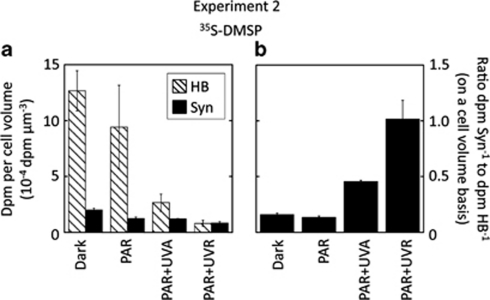
Figure 3.
Experiment 2. (a) Comparison of 35S-DMSP retained per cell volume (d.p.m. per μm3) between heterotrophic bacteria and Synechococcus under different light conditions. Values are means ± standard errors. (b) Ratio between the 35S-DMSP uptakes per cell volume of Synechococcus (Syn) and heterotrophic bacteria (HB) under different light conditions.

