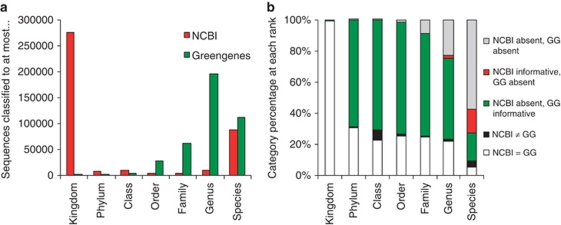
Figure 2.
A comparison of the NCBI taxonomy to the updated Greengenes taxonomy for sequences in tree_16S_all_gg_2011_1. (a) Lowest taxonomic rank assigned to each sequence; (b) taxonomic differences between NCBI and Greengenes at each rank, showing the percentage of sequences classified to each of five possible categories (see inset legend; GG, Greengenes) highlighting cases where NCBI and Greengenes differ.

