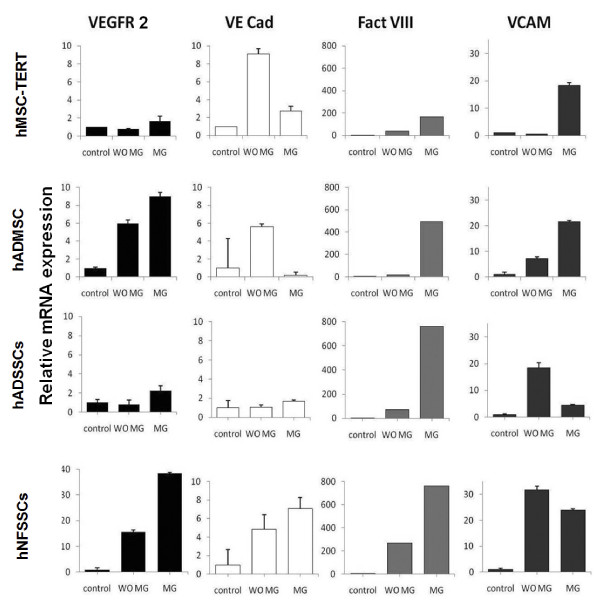
Figure 5.
Quantitative real-time PCR (qRT-PCR) analysis of endothelial-associated gene expression in induced and non-induced cells. After endothelial differentiation for 7 days, cells cultivated on matrigel (MG) and without matrigel (WO MG) for additional 3 days were harvested, and total RNA was extracted and the expression of endothelial and angiogenesis-associated genes were quantified. Gene expression was normalized to beta-actin and is presented as a fold change over non-induced (control) cells. Data are shown as mean ± S.D of at least two independent experiments, n = 2.

