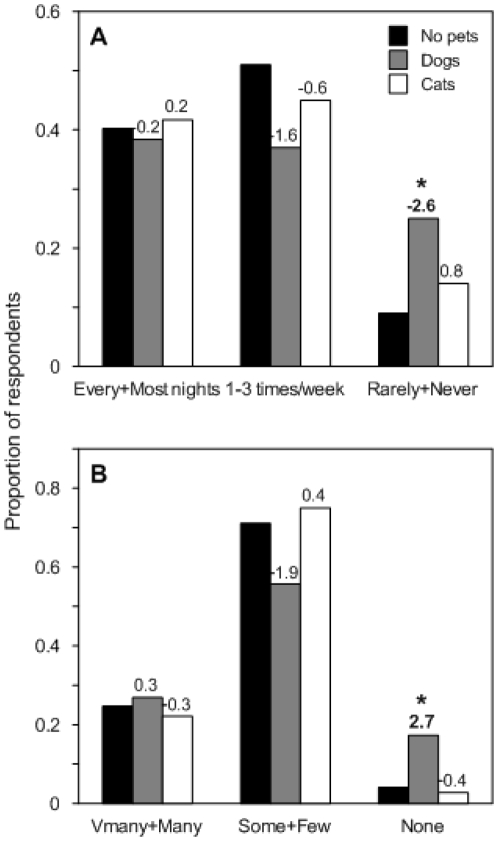
Figure 1. Typical frequency (A) and quantity (B) of diggings appearing in yards with each pet type.
Dog owners were more likely to report rarely or never seeing fresh diggings (A), and seeing no new diggings (B). Data are proportions of survey respondents choosing each answer. Numbers above the bars are adjusted standardized residuals from the contingency analysis of each question for dogs versus no pets and cats versus no pets. Residuals greater than two indicate a lack of fit of the null model in that cell (denoted by asterisks). Negative residuals indicate a smaller proportion choosing that answer, and positive residuals indicate a greater proportion choosing that answer than expected if factors were independent.

