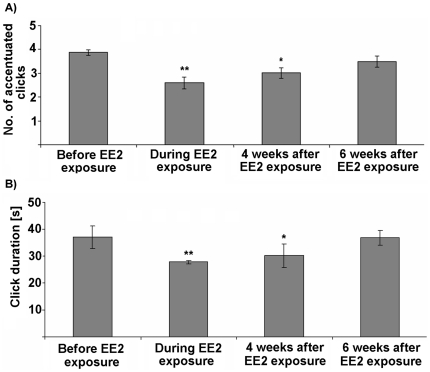
Figure 5. Reversibility of call modifications due to EE2 exposure.
Median ± interquartile ranges (n = 10) of (A) no. of accentuated clicks and (B) duration of clicks within the advertisement calls before, during, and four and six weeks after EE2 exposure (at 2.96 µg/L). Statistical differences were determined using two-tailed Wilcoxon signed-rank tests for paired samples. To control for type I errors from conducting multiple tests, false discovery rate (FDR) was applied. Significant differences are marked by asterisks (* p≤0.05; ** p≤0.01; *** p≤0.001).

