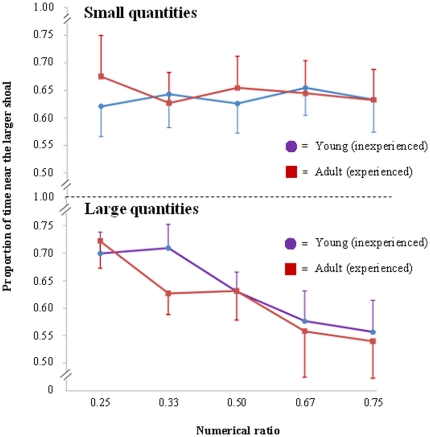
Figure 4. The results of the fish experiment.
The proportion of time spent near the larger shoal is plotted against the numerical ratio of the contrasts for both large and small number (1–4) ranges. The performance of the fish (both experienced and inexperienced fish) adhered to the same patterns as for humans in the two numerical ranges, with ratio sensitivity only being shown in the large number range. Bars represent the standard error.

