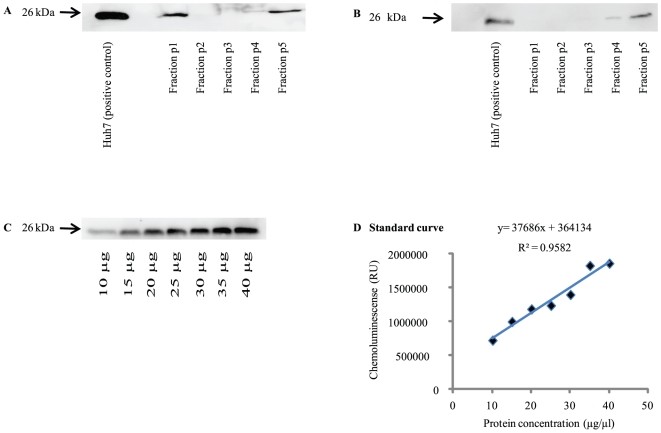
Figure 1. Enrichment and quantification of soluble CD81.
(A, B) Immunoblotting of soluble CD81 is shown after enrichment by differential centrifugation of frozen (A) plasma and (B) serum samples. Huh7 cells served as positive control, and HepG2 cells as negative control. While only a marginal fraction was detectable in fraction p4, the main portion was detectable in fraction p5, comparable between plasma and serum samples. (C, D). Soluble CD81 concentration was assessed semi-quantitatively by use of dilutions from a Huh7 cell lysate by densitometric analysis. The lysate dilution immunoblot analysis and the corresponding obtained standard curve are shown in (C) and (D), respectively.

