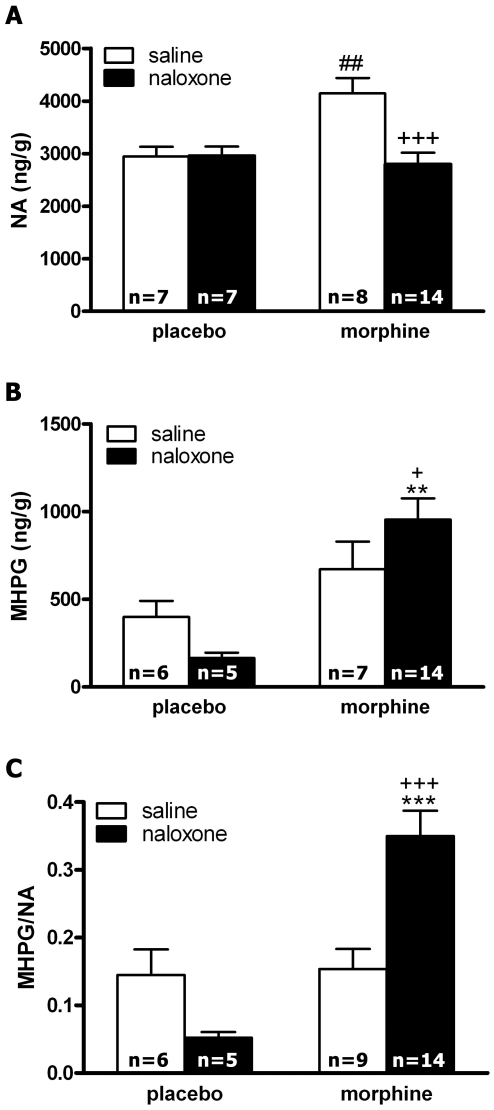
Figure 1. Effects of naloxone-induced morphine withdrawal on NA and MHPG levels at the PVN and on NA turnover (as estimated by the MHPG/NA ratio.
Morphine withdrawal increased MHPG production and NA turnover. Data represent the mean ± SEM 60 min after naloxone injection to control pellets- or morphine-treated rats. **p<0.01; ***p<0.001 vs. control pellets (placebo)+naloxone; +p<0.05, +++p<0.001 vs. morphine-treated rats+saline; ## p<0.01 vs. placebo-treated rats+saline.

