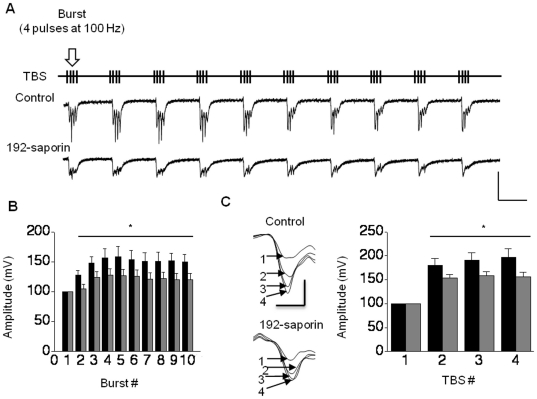
Figure 3. Reduction in the TBS facilitation in 192-saporin infused rats.
(A) TBS stimulation protocol and samples of TBS induced traces from saline infused control and 192-saporin infused rats. (B) Bar chart exhibiting reduction of facilitation within the first TBS in 192-saporin infused rats (gray) compared to the controls (black); Calibration: 4 mV, 200 ms. (C) Facilitation of between TBS potentiation was impaired in 192-saporin infused rats (gray bars) compared to the saline infused controls (black bars) as shown by the sample traces and the bar chart. Sample traces are the fEPSPs in response to the first pulse in the first TBS. Calibration: 2 mV, 20 ms.

