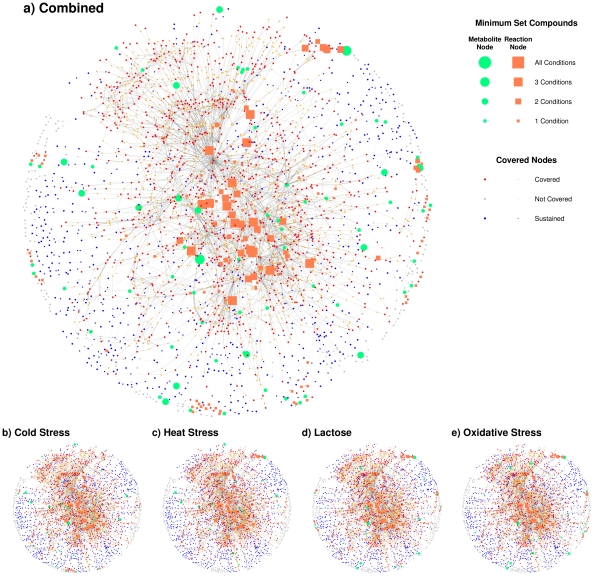
Figure 2. Minimum set network visualization for all stress conditions combined, and for each separately.
Green circles are minimum set metabolites and orange squares are hub reactions. The node size reflects how many stress conditions each node is observed. Small red circles and orange squares are metabolites which can be produced by a significant path and reactions respectively. Blue nodes are metabolites which are included in a path included within the minimum set, but have no significant path terminating at that metabolites. Gray nodes are not included in any path.

