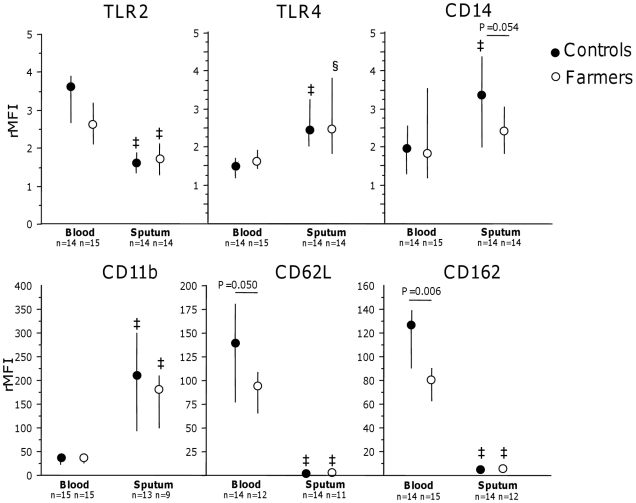
Figure 2. Surface expression of pattern recognition receptors and adhesion proteins on blood and sputum neutrophils.
Surface expression of TLR2, TLR4, CD14, CD11b, CD62L and CD162 on blood and sputum neutrophils. P-values indicate differences between the groups. rMFI = relative mean fluorescence intensity. Medians and 25th–75th percentiles are presented. § indicates p<0.05 and ‡ indicates p<0.01 for within group comparisons between blood and sputum.

