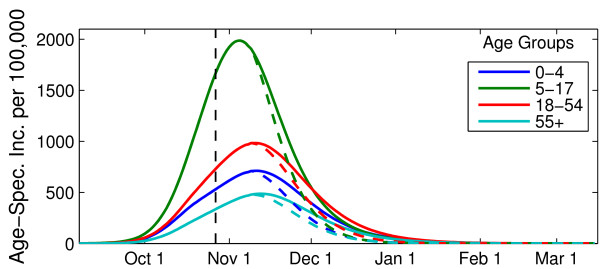
Figure 2.
Age-specific daily incidence of pH1N1 cases. The number of new cases per day per 100,000 individuals is presented in the absence (solid lines) and presence (dotted lines) of pH1N1 vaccination. Vaccination began the week of October 26, 2009 and continued for 8 weeks, to obtain the actual coverage levels outlined in Table 2. The resulting epidemic curves assume R0 of 1.4, latent period of 3 days, and infectious period of 7 days.

