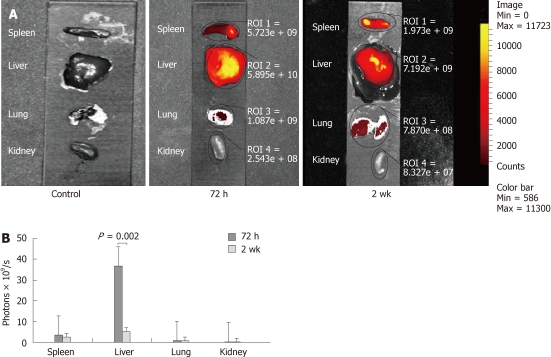
Figure 3.
Ex vivo images showing the distribution of fluorescent cells in different organs as detected by the indocyanine green filter of the IVIS. A signal was detected at the site of injection in the spleen; however, the highest signal was noticed in the center of the liver at 72 h. which faded out by the 2 wk time-point. A weak fluorescent signal was also detected in the lungs at 72 h and 2 wk, but not seen in kidneys at any time-points (A). A graph showing the highest uptake of cells in the liver at all time-points with a significant drop at 2 wk (B).

