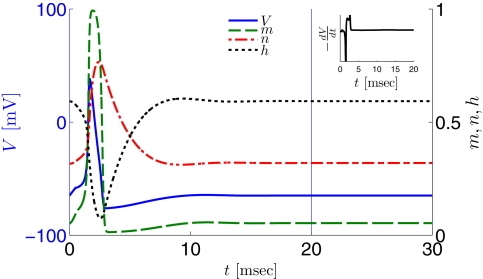
Figure 2.
Fitted HH model variables V, m, n, and h after an AP relax to steady state on a shorter timescale than the minimal stimulation period used (T ≥ 20 ms for Gal et al., 2010, marked as a vertical line). This remains true when no AP is generated, since then the perturbation from steady state is even smaller. This timescale separation indicates that the system has no memory of previous pulses – so all stimulation pulses produce the same response. Note also that the AP voltage pulse width is similar to Figure S1B of Gal et al. (2010). Inset: −dV/dt during an AP, which is proportional to extracellular measured voltage trace (Henze et al., 2011). The AP pulse width is similar to Figures 1B, 2A, and 5C of Gal et al. (2010). Parameters: I0 = 15 μA.

