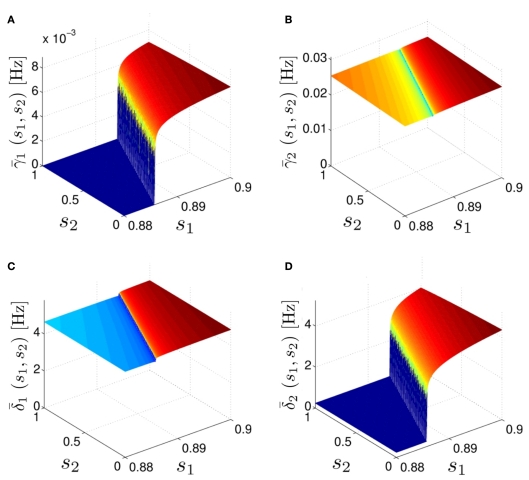
Figure 5.
Average activation and inactivation rates for the HHSAP model, where s is held constant. (A) (B) (C) (D) and are almost constant, while and have a sharp discontinuity near the threshold area Θ (Figure 3B). I0 = 8 μA, T = 50 ms with V, m, n, h initial conditions set at steady state value.

