Figure 8.
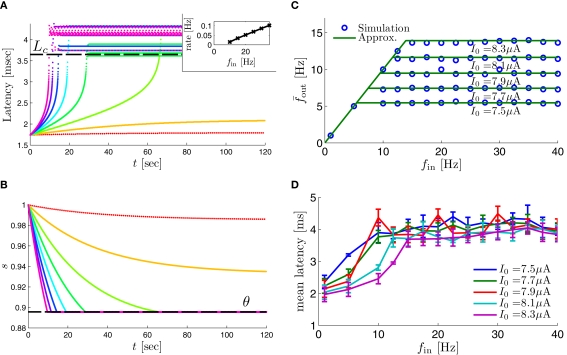
Fitted HHS model – response dependency on fin. (A) Spike latency as a function of time from stimulation onset (each color designates a different stimulation rate): stimulation at I0 = 7.9 μA and rates of fin = 1, 5, 10, 15, 20, 25, 30, 35, 40 Hz (red, orange…,); The transient phase speeds up when fin is increased, and ends at the same critical latency Lc. Similar to Figure 4A of Gal et al. (2010). Inset: the rate is the reciprocal of the timescale of the transient phase, defined as halftime the latency reaches the critical latency, as in Gal et al. (2010). Notice that the rate is linear in fin, as predicted by equation (3.1), and similar to Figure 4B of Gal et al. (2010). Both of these results can be explained by (B) the sodium availability trace, s(t) [using same color code as in (A)] where s transient speeds up when fin is increased, while θ does not change. (C) Dependency of steady state firing rate on stimulation frequency. Comparison between simulation and approximation of equation (3.3), for different values of I0: in fitted HHS model – for (stable mode), and then for (intermittent mode). Compare with Figure 4C of Gal et al. (2010). Notice also that in both cases, increases with I0, as expected from equation (3.2), and the fact that θ decreases in I0. (D) Mean latency at steady state as a function of fin, shows an initial increase [stable mode, where should indeed increase in fin, by equations (2.23 and 2.18)] and then saturates (intermittent mode, where L ≈ L(θ) is indeed independent of fin), as seen in (Gal et al., 2010) Figure 4D. Also, the error bars indicate the SD of the latency – or the latency fluctuations. These fluctuations increase in the intermittent mode, as seen in (Gal et al., 2010) Figure 4D, due to the back-and-forth motion of s around θ at this mode, and the high sensitivity of L(s) near s = θ.

