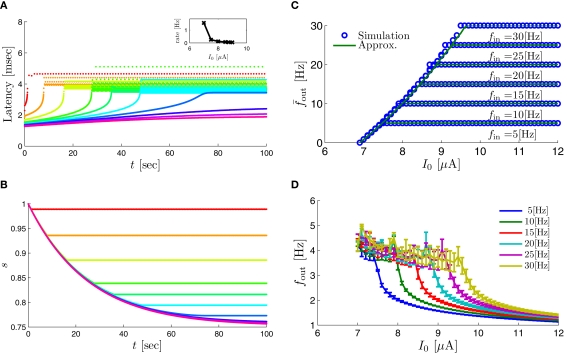
Figure A1.
Dependency on stimulation amplitude, I0, in the fitted HHS model – (A) Spike latency as a function of time from stimulation onset (each color designates a different stimulation rate): stimulation at fin = 25 Hz and I0 = 7, 7.5, 8, 8.5, 8.75, 9, 9.25, 9.5, 9.75, 10 μA (red, orange…,); The transient slows down when I0 is increased, and both initial and critical latencies change. Inset: the rate indeed decreases with I0, and there exist two critical currents: which is the minimal current to generate an AP (here ) and which is the maximal current for which intermittent mode is reached (here ). For the steady state is the stable mode. These results can be explained by (B) the sodium availability trace s(t) (using same color code as in A), where we see that when I0 is increased then θ is decreased, while the transient rate of s is hardly affected. (C) Steady state firing rate is 0 for for all fin. It then increases quadratically in I0 during the intermittent mode, until saturates when the stable mode is reached – at which depends on fin. (D) Steady state latency dependence on I0. For fin = 25 Hz, the mean latency at steady state always decreases as a function of I0. This mainly occurs since the latency function decreases with I0 (Figure 3). However, during the intermittent mode, L ≈ L(θ), while θ decreases with current. Since L(s) is decreasing, this makes the decline of L in the intermittent mode less steep than in the stable mode, where and does not change with I0. Here we also see that the latency fluctuations in the intermittent mode are much larger than in the stable mode.

