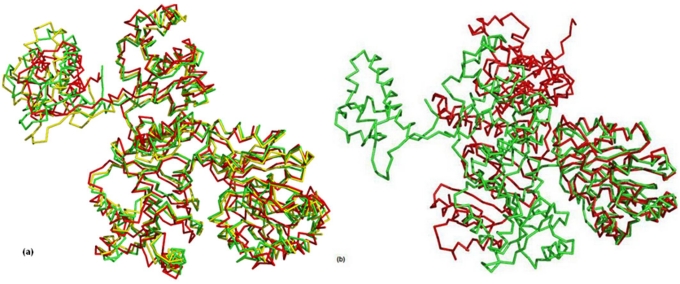
Figure 3.
(a) Representative structures of major clusters for RecQ at 840ps (green), 1440ps (yellow) and 4760ps (red) time steps, respectively; (b) Representative structure of major clusters for DNA-RecQ complex at 800ps (green) and 3700ps (red) time steps, respectively. Hinge motion moves the helicase subdomain2 away from the helicase subdomain1.

