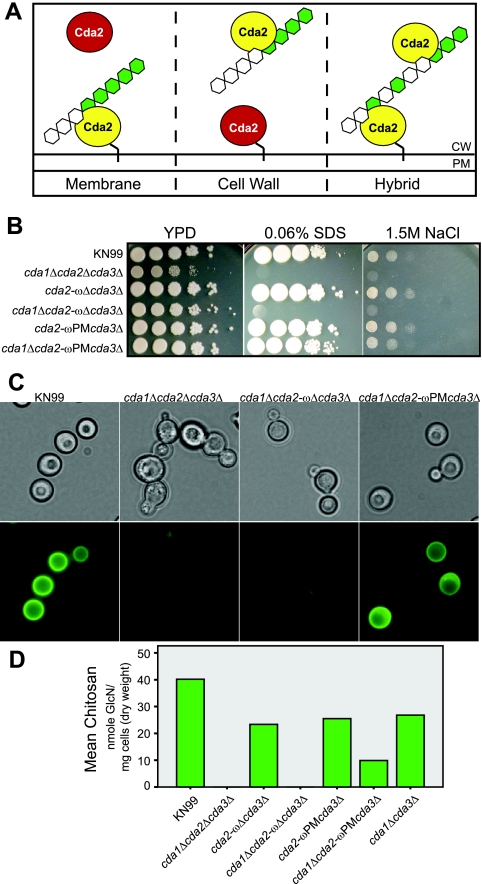
FIG 6 .
Implications of Cda2 localization for chitosan synthesis. (A) Proposed models of chitosan production with respect to Cda2 localization in C. neoformans. Ovals represent Cda2, with yellow indicating the enzyme that functions to produce cell wall chitosan. The black line linking Cda2 to the membrane represents the GPI anchor. CW, cell wall; PM, plasma membrane. (B) Plating experiment illustrating the sensitivity of the cda1Δ cda2-ωΔ cda3Δ mutant, which is analogous to that of the chitosan-deficient cda1Δ cda2Δ cda3Δ strain, and the wild-type growth of the cda1Δ cda2-ωPM cda3Δ mutant. (C) Eosin Y staining of Cda2 ω site mutants. (D) Chitosan levels in cell walls from Cda2 ω site mutants. The cda1Δ cda3Δ strain was included as a control for the chitosan produced by a strain expressing wild-type CDA2 in the absence of the other two chitin deacetylases. Values are averages of results from two independent biological replicates for each strain.

