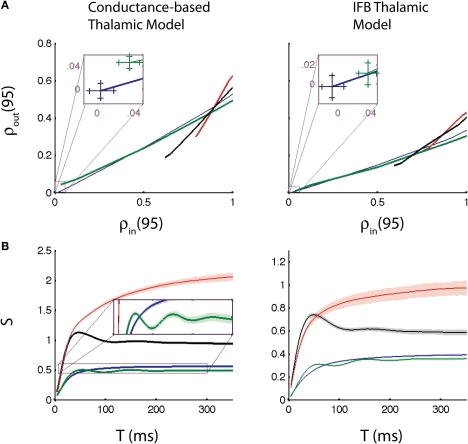
Figure 4.
Input-output correlation relationships and correlation susceptibility. (A) Output correlation vs. input correlation for T = 95 ms, including zoomed view near the origin (insets). Curves were generated by varying cin steps from 0 to 1 and computing ρin and ρout for each model, for each c. (B) Correlation susceptibility (S) vs. T. The inset in (B) shows the oscillations in the susceptibility when the thalamic neurons receive oscillatory inputs. The conductance-based model (left), and the IFB model (right) are both shown. The following input conditions are used: normal (blue), oscillatory (green), bursty (red), and oscillatory bursts (black). Error bars in the insets in (A) and confidence bands on the correlation susceptibility in (B) show 98% confidence intervals, calculated using bootstrapping techniques.

