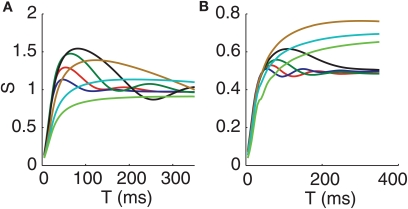
Figure 5.
Oscillation frequency of S tracks GPi oscillation frequency while oscillation amplitude of S depends non-monotonically on GPi oscillation frequency. (A) Oscillatory bursts in the inputs from GPi to the conductance-based thalamic model. (B) Non-bursty oscillations in GPi inputs to the conductance-based thalamic model. Frequencies are 10 Hz (dark blue), 8 Hz (red), 6 Hz (green), 4 Hz (black), 2 Hz (tan), 1 Hz (light blue), and 0.5 Hz (green). Note that while two of the curves are colored green, the 0.5 Hz green curve is qualitatively similar to the 1 Hz curve and thus can be clearly distinguished from the 6 Hz green curve.

