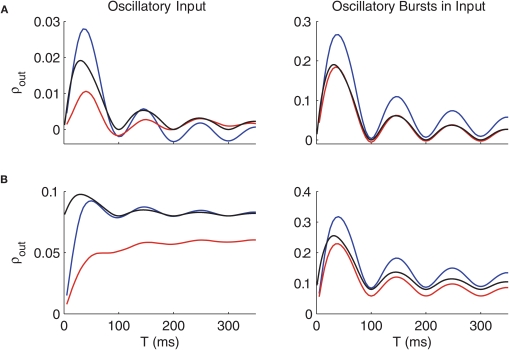
Figure 8.
Oscillations of ρ obtained from calculations on the point process model match those in ρout from thalamic model simulations. (A) Comparison of correlation coefficients for the voltage-based thalamic models (conductance-based model, blue; IFB model, red) with input correlation of c = 0and the point process model (black) with c = 0.08. (B) As in (A) with c = 0.2 in the thalamic models. Non-bursty oscillatory inputs from GPi are shown on the left, oscillatory bursty inputs on the right; in both cases, oscillations occur at a frequency of 10 Hz. Parameters for the point process model are D = 0.1, U0 = 1, and η = 0.4 for oscillatory inputs and D = 0.35, U0 = 1, and η = 1 for oscillatory bursts.

