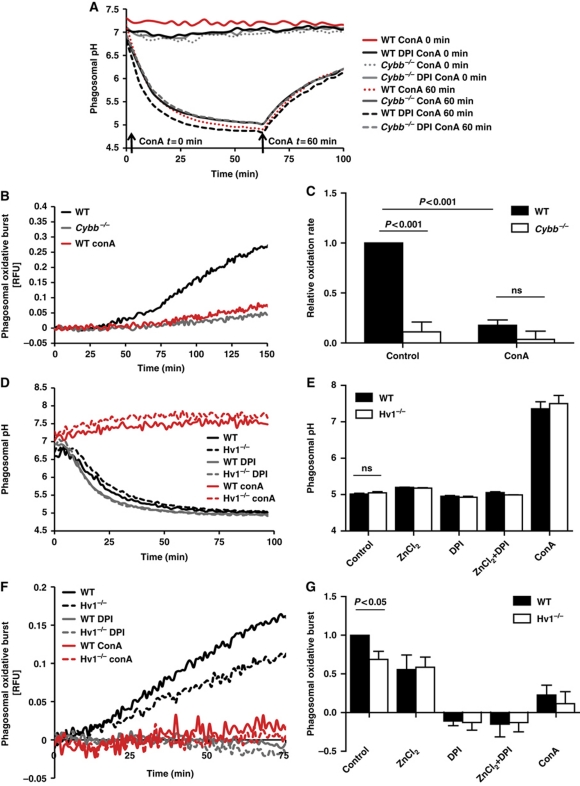
Figure 4.
Dependence of NOX2 activity on charge compensation provided by V-ATPase and Hv1 in BMDC phagosomes. (A) Representative real-time acidification profiles of phagosomes containing IgG-, CFSE-coupled experimental particles in WT and Cybb−/− BMDCs (± 0.5 μM DPI) with the addition of the V-ATPase inhibitor concanamycin A (100 nM) (ConA) prior to, or after, acidification of the phagosome. (B, C, F, G) NOX2 activity in BMDC phagosomes was evaluated by measuring fluorescence released during oxidation of particle-conjugated H2HFF-OxyBURST substrate (λex485 nm; λem520 nm) relative to a calibration fluor Alexa Fluor 594 (λex594 nm; λem620 nm) in the presence of V-ATPase inhibitor concanamycin A (100 nM) (ConA), Hv1 inhibitor ZnCl2 (50 μM) and/or DPI (0.5 μM DPI). (B, F) Representative real-time traces. (C, G) Average rates of substrate oxidation over three independent experiments relative to untreated controls. Error bars represent s.e.m. P-values were calculated using ANOVA. (D, E) Acidification of phagosomes containing IgG-, CFSE-coupled experimental particles in WT and Hv1−/− BMDCs (±0.5 μM DPI, ±100 nM ConA). (D) Representative real-time acidification profiles. (E) Average of final phagosomal pH at 70 min after phagocytosis from three independent experiments. Error bars represent s.e.m. P-values were calculated using ANOVA.

