Figure 3.
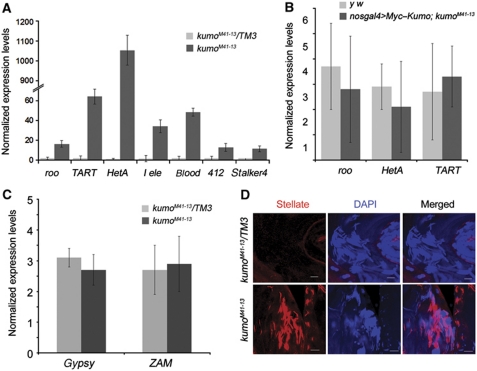
kumo is involved in the repression of transposons. (A) Quantitative RT–PCR using ovarian RNA extracted from kumo mutant and control ovaries showing the expression levels of representative transposons expressed in the germline. Significant upregulation is seen in the kumo mutant ovaries compared with those in the heterozygous control. (B) Quantitative RT–PCR showing the relative expression levels of roo, HeT-A and TART in ovaries expressing Myc–Kumo in kumo mutant germline cells and control y w ovaries. (C) Quantitative RT–PCR showing no significant differences in the expression levels of gypsy and ZAM transposons, predominantly expressed in somatic cells, between kumoM41-13/TM3 and kumoM41-13 ovaries. The expression levels were normalized with the controls, actin5c and rp49. Error bars indicate the standard deviation of three independent sets of experiments. (D) Immunostaining for Ste (red) with DAPI (blue) showing the upregulation of Ste in kumo mutant testis. Scale bar: 20 μm.

