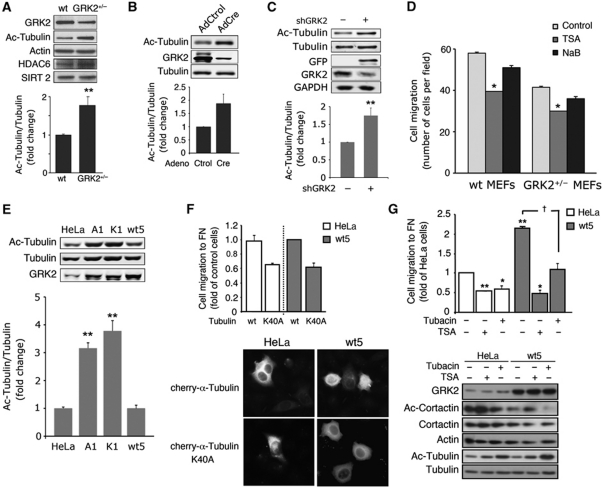
Figure 1.
GRK2 expression levels modulate the extent of tubulin acetylation in MEFs and HeLa cells in a kinase activity-dependent manner. (A–C) Downregulation of GRK2 expression enhances tubulin acetylation. MEFs derived from wt or hemizygous GRK2 mice (A), as well as from GRK2-floxed mice infected with control or Cre-recombinase expressing adenovirus (B) or HeLa cells transfected with either a control or a GRK2 silencing construct (C) were lysed and levels of HDAC6, SIRT2, GRK2, tubulin, acetylated tubulin (Ac-tubulin) and actin or GADPH (as loading controls) were determined by western blot analysis. Data of normalized Ac-tubulin levels are mean±s.e.m. from three independent experiments. (D) Motility of MEFs depends on GRK2 expression levels and HDAC6 activity. Cells as in (A) were seeded on Transwell filters precoated with FN (20 μg/ml) in the presence of HDAC inhibitors (TSA, NaB) or vehicle (control). Cell migration was assessed as detailed in Materials and methods. Data are mean±s.e.m. of three independent experiments performed in duplicate. (E) Ac-tubulin markedly accumulates in HeLa cells upon expression of catalytically inactive GRK2 or of the S670A mutant. Parental HeLa cells or cells stably expressing GRK2-wt (wt5), GRK2-S670A (A1) or GRK2-K220R (K1) mutants were analysed for GRK2 levels and the extent of tubulin acetylation determined as above. (F, G) Dynamic deacetylation/acetylation of α-tubulin is involved in the effect of GRK2 on cell migration. Parental and HeLa cells with extra GRK2 were co-transfected with cherry-α-tubulin-wt or cherry-α-tubulin-K40A and the CD-8 antigen (F) or treated (G) with either the general HDAC inhibitor TSA (1 mM) or the HDAC6-specific inhibitor tubacin (15 μM). Transfected tubulin constructs were expressed at similar levels as detected by confocal microscopy (F) and cells positive for co-transfected CD8 were sorted for migration assays by using microbeads precoated with anti-CD8 antibody. Chemotactic motility to FN was assessed as in (D). Data are mean±s.e.m. of three independent experiments performed in duplicate. Total and acetylated levels of α-tubulin and cortactin were measured by western blot (G). Total α-tubulin and actin serve as loading controls. Representative blots are shown in most panels. †P<0.05, *P<0.05, **P<0.01, compared with parental, control transfected or infected cells or with vehicle-treated cells, unpaired two-tailed t-test. Figure source data can be found in Supplementary data.

