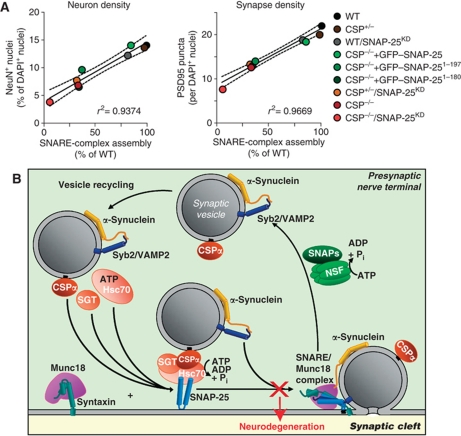
Figure 7.
Correlation of SNARE-complex levels with neurodegeneration. (A) Linear relationship between SNARE-complex assembly and neuronal loss (left) or synapse loss (right). Dotted lines show 95% confidence interval. (B) Model depicting the presynaptic SNARE cycle. ‘X’ indicates the disruption of SNARE-complex assembly, which leads to neurodegeneration. VAMP2, vesicle-associated membrane protein 2; SNAP, soluble NSF attachment protein.

