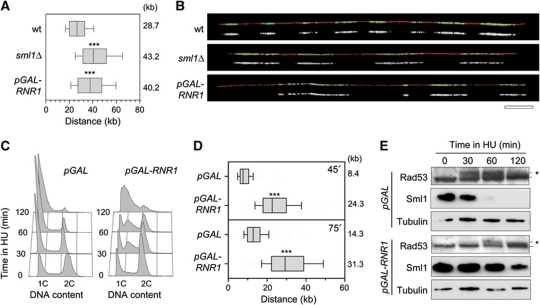
Figure 2.
Increased dNTP pools accelerate fork progression. (A) Exponentially growing wild-type (PP872) and sml1Δ (PP924) cells were pulse labelled with 400 μg/ml BrdU for 30 min. Prior to BrdU labelling, pGAL-RNR1 (PP918) cells were incubated for 2 h in the presence of 2% galactose. DNA fibres were analysed by DNA combing. Graph depicts the distribution of BrdU tracks length. Box and whiskers indicate 25–75 and 10–90 percentiles, respectively. Mean BrdU tracks length is indicated in kb. Asterisks indicate the P-value of the statistical test (Mann–Whitney rank sum t-test, ***P-value <0.0001). (B) Representative images of DNA fibres are presented. Green: BrdU, red: DNA. Bar, 50 kb. (C–E) Exponentially growing pGAL (PP917) and pGAL-RNR1 (PP918) cells were cultured for 2 h with 2% galactose before addition of 100 mM HU. (C) Flow cytometry profiles of pGAL and pGAL-RNR1 cells during the time course in HU. (D) After 30 min in HU, BrdU was then added for 45 or 75 min. DNA fibres were analysed by DNA combing. Box and whiskers indicate 25–75 and 10–90 percentiles, respectively. Mean BrdU tracks length is indicated in kb. (E) Protein extracts were collected during the time course and subjected to SDS–PAGE followed by an immunoblotting with antibodies against Rad53, Sml1 and tubulin. Asterisks indicate the hyperphosphorylated form of Rad53. Figure source data can be found in Supplementary data.

