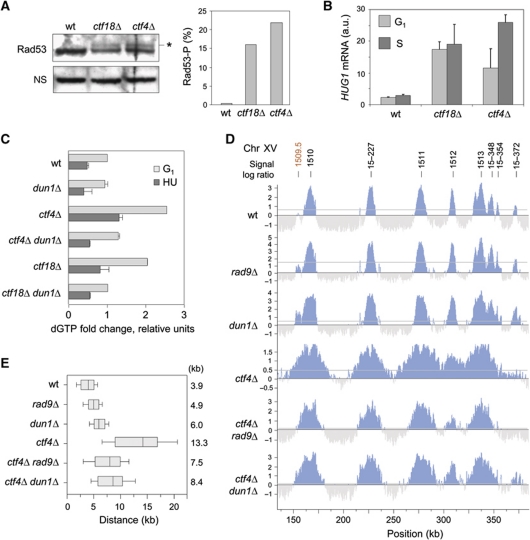
Figure 6.
Spontaneous DNA damage increases dNTP production in ctf4Δ and ctf18Δ mutants. (A) Protein extracts from asynchronous wild-type, ctf18Δ and ctf4Δ cells were collected and subjected to SDS–PAGE followed by an immunoblotting anti-Rad53. Star indicates Rad53 phosphorylated form. The histogram is a quantification of Rad53-P levels relative to Rad53. (B) Relative mRNA levels of HUG1 in wild-type, ctf18Δ and ctf4Δ cells in G1 and after 40 min in S-phase. Error bars indicate standard deviation from three independent experiments. (C) Relative dGTP levels in wild-type (PP872), dun1Δ (PP1387), ctf4Δ (PP908), ctf4Δdun1Δ (PP1322), ctf18Δ (PP907) and ctf18Δ dun1Δ (PP1321) strains in G1 and after 60 min in 200 mM HU. (D, E) Cells were synchronized in G1 with α-factor, and released into medium containing 200 mM HU and 400 μg/ml BrdU for 60 min to perform BrdU-IP-chip. (D) Replication profiles of a representative region of chromosome 15 in wild-type (PP872), rad9Δ (PP914), dun1Δ (PP1387), ctf4Δ (PP908), ctf4Δrad9Δ (PP851) and ctf4Δdun1Δ (PP1322) strains. Significant peaks are filled in blue, horizontal grey lines indicate the threshold used for peak calling (50% of signal range). Early and late origins are labelled in black and red, respectively. (E) Distribution of the distances covered by individual replication forks in the indicated strains. Box and whiskers indicate 25–75 and 10–90 percentiles, respectively. Mean BrdU tracks length is indicated in kb. Figure source data can be found in Supplementary data

