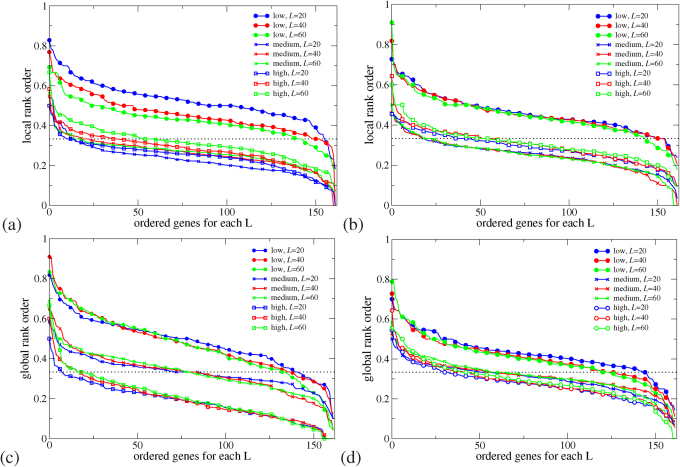
Figure 1. Sorted prevalence of the low, medium and high CT change among local (a+b) and global (c+d) rankings for pathogenic mutations in 162 genes using the 1D (a+c) and the 2-leg (b+d) models.
Results are consistent for all three lengths L = 20, 40, 60. The 1/3 value expected by chance is shown as a dashed horizontal line. Low rankings are dramatically more prevalent locally and globally than chance would suggest.

