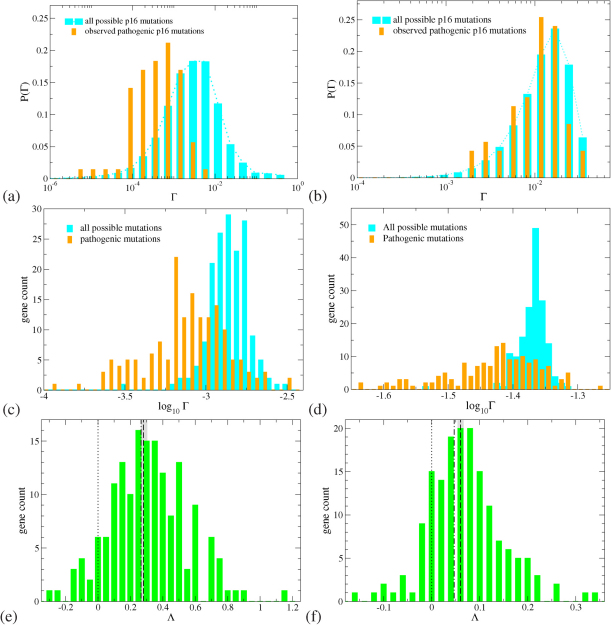
Figure 2.
(a+b): Distribution of the change in charge transport Γ for pathogenic (orange bars) and all possible (cyan bars) mutations for the p16 (CDKN2A) gene with 26740 base pairs and 111 known pathogenic mutations. (c+d): Distribution of the average (logarithmic) change in charge transport 〈log Γ〉 for all pathogenic (orange bars) and all possible (cyan bars) mutations for all 162 genes. (e+f): Distribution of the global shift Λ values for all genes, showing a consistent tendency to positive values. The average  (dashed) and weighted average
  (dash-dotted) values are indicated by vertical lines similarly to the 0 line (dotted). The grey bars denote the error of mean for
  . The results for the 1D and 2-leg models are displayed in panels (a,c,e) and (b,d,f), respectively. All results shown are for L = 40, data for L = 20 and 60 are similar.

