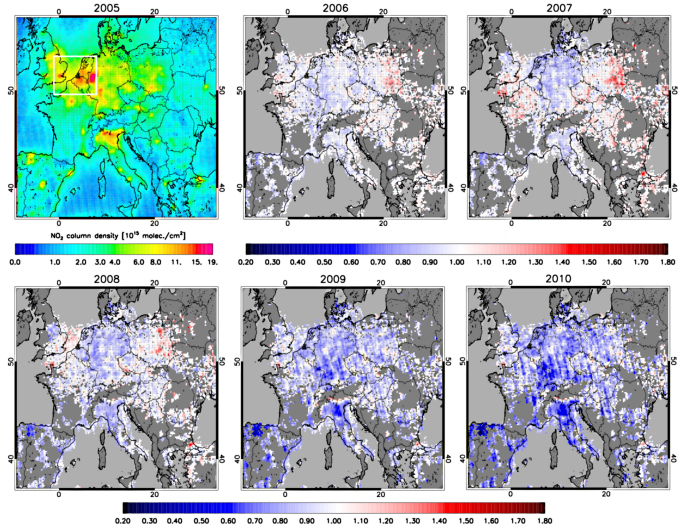
Figure 2. August 2005 average low-pass filtered OMI tropospheric NO2 columns (n103,6) (top left), and the 2006–2010 August average low-pass filtered NO2 columns normalized by August 2005 values.
Grid cells are considered if less than 5% of the original data were invalidated and the resulting probability distribution does not differ significantly from the original data (Mann-Whitney U test, p = 0.05 one-tailed)(See Supplementary Information).

