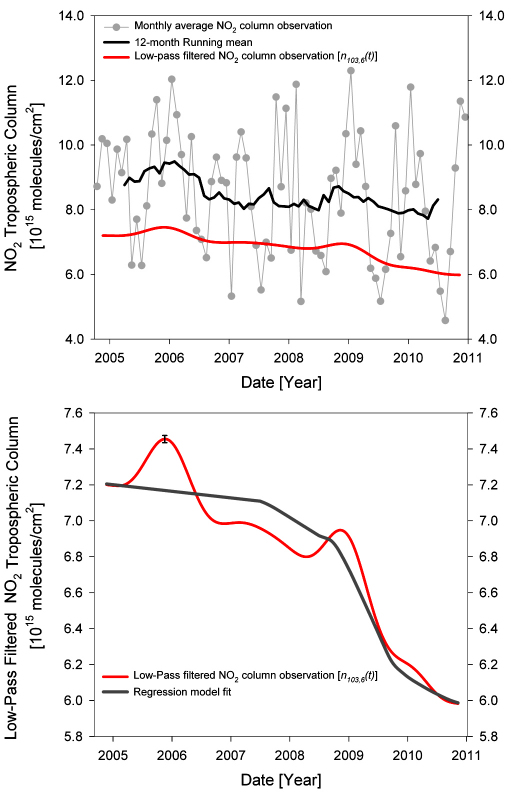
Figure 3. The top panel shows the observed monthly average NO2 column (grey circles) averaged over the eastern United Kingdom, Belgium, Luxembourg, and the Netherlands (area indicated by the white box in Figure 2(top left)) and their 12-month running mean (black line).
The red line indicates the corresponding average low-pass filtered signal. The bottom panel shows again the Benelux-UK average low-pass filtered NO2 column (red line) with the fit of the regression model (Eqn. 1) to the data (grey). The uncertainty in the average observed NO2 column (black error bar) represents the precision of the spatial average over the Benelux-UK area. The measurement precision in each grid cell that is propagated when taking the average is derived by assuming σ = 5% as discussed in the Supplementary Information – “Regression Modeling”. The standard error in the average regression model fit is commensurate with the thickness of the line.

